The Top X Bottom X widget shows the best and worst performers in a level, configured for either overall score or individual sectional scores.
The widget can be set to a specific level, or to show only the best or worst performers.
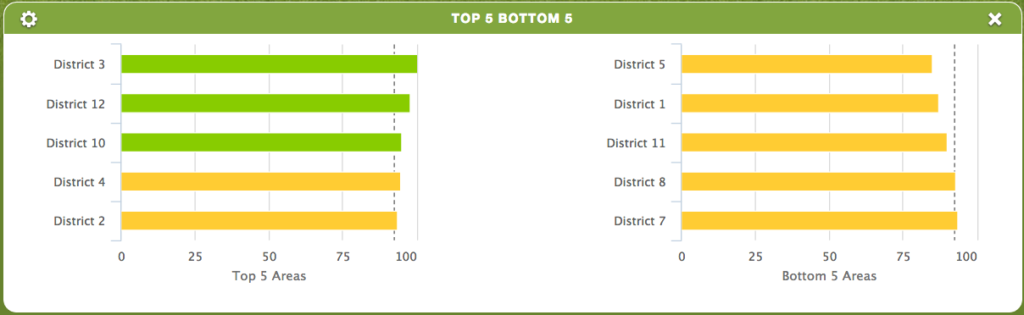
The dotted line on the bar graph represents overall company average.
Surveys Sections Show Levels Number of Bars Data Ranges Groups Waves Widget Title Heat Map Show Top or Bottom PDF Page Breaks